Double Descent in Deep Learning
Introduction
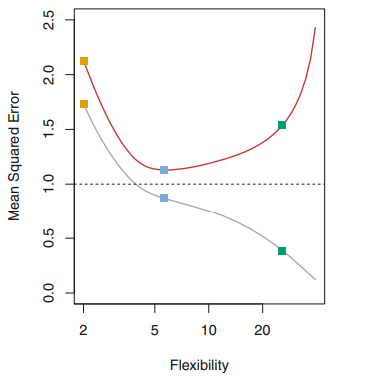
The classical U-Shape observed when analyzing the performance (usually some loss function) of a model on testset is a fundamental property that holds regardless of the particular data set at hand and regardless of the statistical method being used.

As it was beautifully explained in the ISLR book. This is conditioned by the Bias - Variance Trade off ( see the equation below)

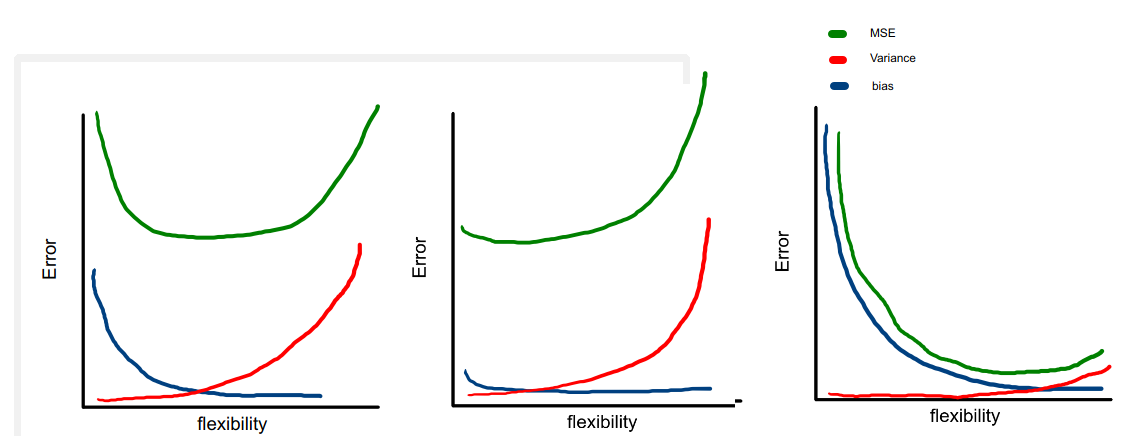
Variance refers to the amount by which the estimated function f would change if we estimated it using a different training data set, while Bias refers to the error that is introduced by approximating a given problem by a much simpler model. More flexible models tends to have low bias but higher variance, while more rigid models (linear regression for instance) have a higher bias but lower variance. At some point we can associate Bias with underfitting while Variance with overfitting. The U-shape will be influenced by Bias and the Variance, and depending the dataset used the U-shape can be different, although maintaining their convex property. (See the example below)

The influence of the variance and bias in three different datasets when using more flexible models. As a general rule, as we use more flexible methods, the variance will increase and the bias will decrease. The relative rate of change of these two quantities determines whether the test MSE increases or decreases. (ISLR)
The double descent problem
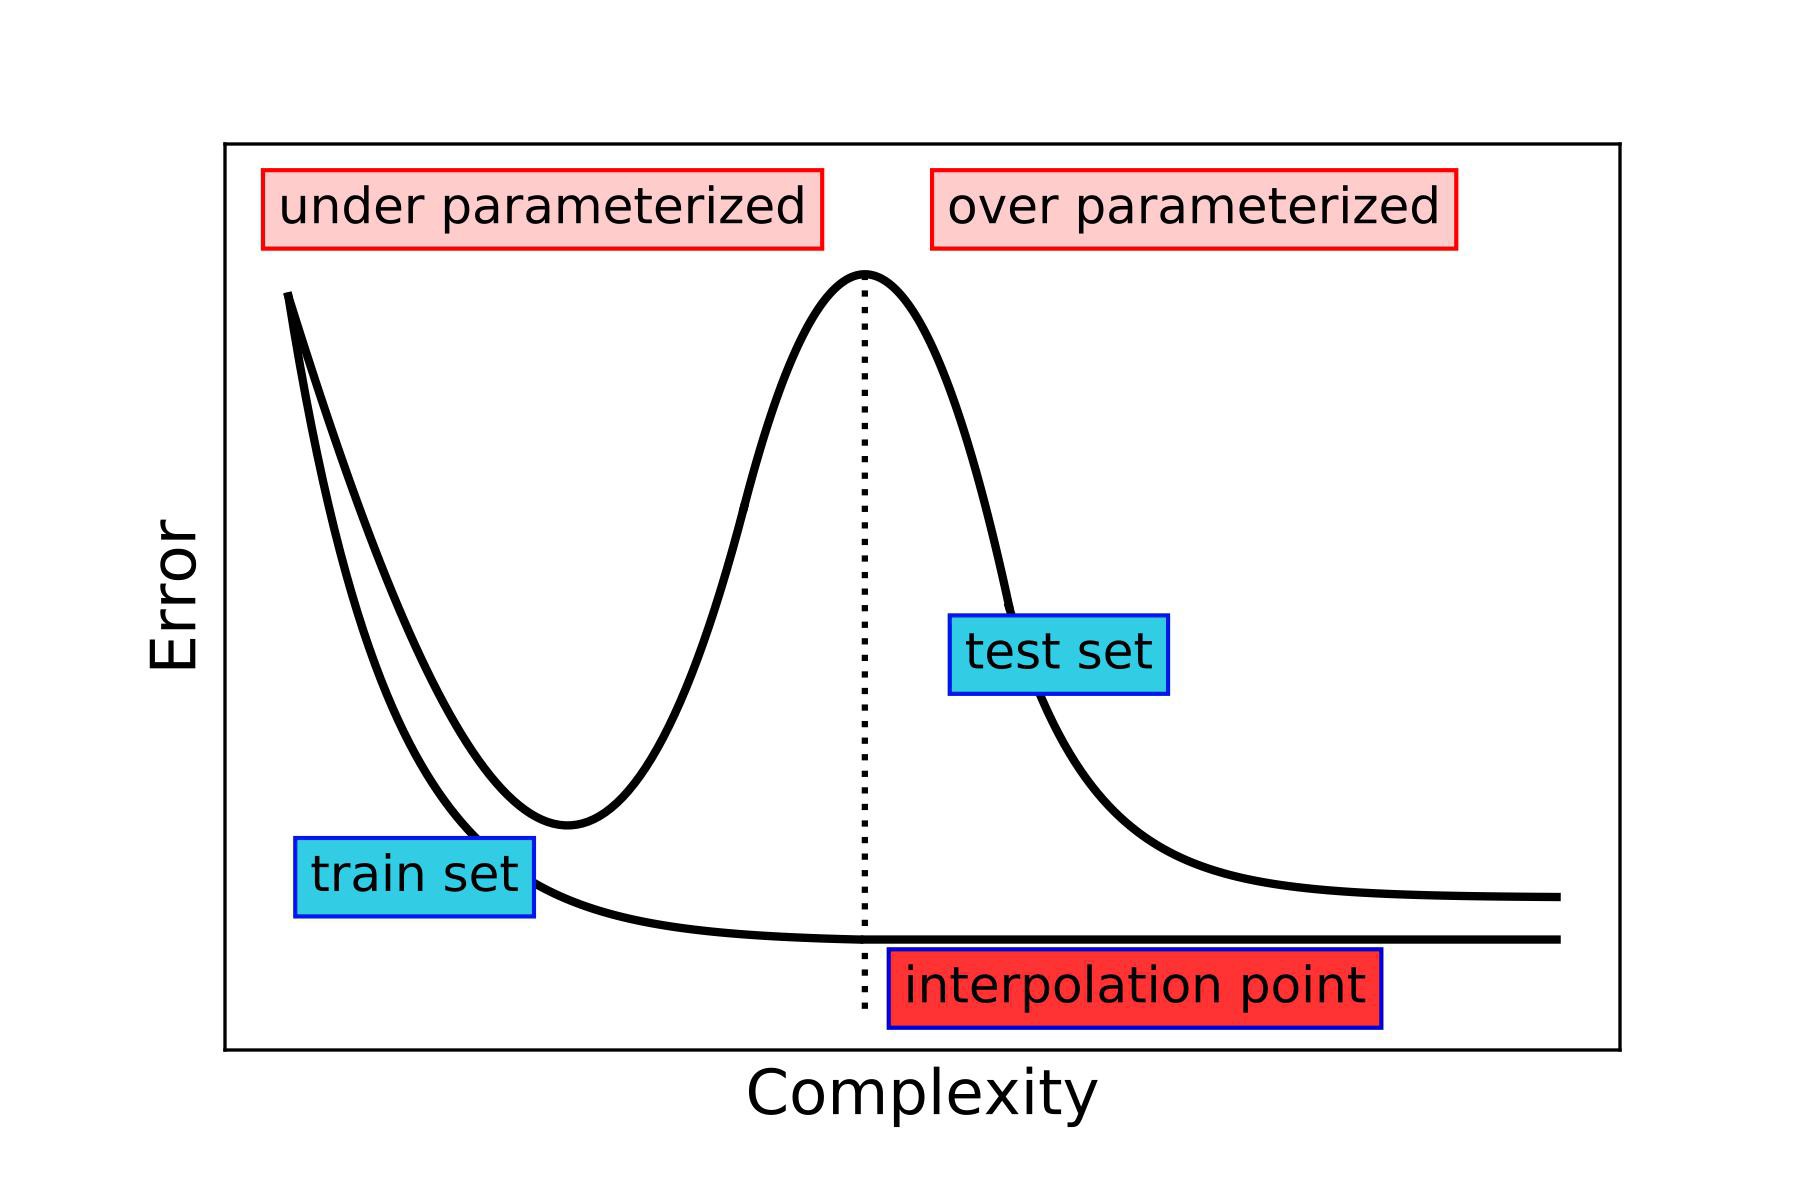
However, recently Deep Learning researcher have observed that as they give more flexibility to a (Deep Learning) model (such as the size, epochs, etc.), the performance first gets worse and then gets better (i.e. No convex shape). This phenomenon is denoted as Deep Double Descent, which is somewhat surprising.

Last weekend, I ran into a lovely explanation from a statistical point of view of the Double descent phenomenon from @daniela_witten one of the authors of the well-known ISLR book.
The resources
I put here some resources related with the phenomenon:
- An article from OPENAI about the observed Double Descent in CNN and RESTnet kind of networks.
- Another post from Medium that describes de Double Descent phenomenon, with point to a analogy between training neural network and fitting dense repulsive particles within a finite volume.
- One of the research paper describing the Double Descent phenomenon.
- An statistical explanation of the phenomenon from @daniela_witten in the form of a twitter thread.
The Bias-Variance Trade-Off & "DOUBLE DESCENT" 🧵
— Daniela Witten (@daniela_witten) August 9, 2020
Remember the bias-variance trade-off? It says that models perform well for an "intermediate level of flexibility". You've seen the picture of the U-shape test error curve.
We try to hit the "sweet spot" of flexibility.
1/🧵 pic.twitter.com/HPk05izkZh
TODO
Find a toy example code and dataset to test different form of double descent.
